Audience
This course is intended for individuals seeking to develop an understanding of Data Science from the perspective of a practicing Data Scientist, including:
• Managers of teams of business intelligence, analytics, and big data professionals
• Current Business and Data Analysts looking to add big data analytics to their skills.
• Data and database professionals looking to exploit their analytic skills in a big data environment
• Recent college graduates and graduate students with academic experience in a related discipline looking to move into the world of data science and big data
Prerequisites
To complete this course successfully and gain the maximum benefits from it, a student should have the following knowledge and skill sets:
• A strong quantitative background with a solid understanding of basic statistics, as would be found in a statistics 101 level course
• Experience with a scripting language, such as Java, Perl, or Python (or R). Many of the lab examples taught in the course use R (with an RStudio GUI), which is an open source statistical tool and programming
• Experience with SQL
Skills Gained
Upon successful completion of this course, participants should be able to:
• Identify the pre-requisites for Big Data project
• Gain familiarity Data Analytic Methods Using R
• Use Statistics methods for Evaluation
• Network Analysis, and Data Visualization concepts
• Work with Clustering Algorithms
• Work with Association Rules
• Work with Regression
• Work with Classification
• Work with Time Series Analysis
• Work with Text Analysis
Course outline
Module 1: Introduction to Big Data Analytics
• Big Data Overview
• State of the Practice in Analytics
• The Data Scientist
Module 2: Big Data Analytics in Industry Verticals
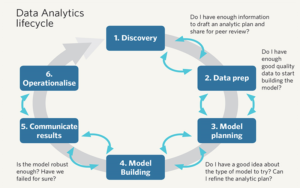
• Data Analytics Lifecycle
• Discovery
• Data Preparation
• Model Planning
• Model Building
• Communicating Results
• Operationalizing
Module 3: Data Analytic Methods Using R
• Basic features of R
• Introduction to R
• Using R to Look at Data
Module 4: Data Exploring and Analyzing Data
• Statistics methods for Evaluation
Module 5: Clustering Algorithms
• Centroid
• Clustering
• K-means
• Unsupervised Learning
• Within Sum of Squares (WSS)
Module 6: Association Rules
• Association Rules
• APiori Algorithm
• Support
• Confidence
• Lift
• Leverage
Module 7: Regression
• Categorical Variable
• Linear Regression
• Residuals
• Logistic Regression
• Ordinary Least Squares (OLS)
• Receiver Operating Characteristic (ROC) Curve
Module 8: Classification
• Classification Learning
• Decision Tree
• Naïve Bayes
• ROC curve
• Confusion matrix
Module 9: Time Series Analysis
• Stationarity
• Time series
• Autocorrelation Function (ACF)
• Autoregressive (AR)
• Moving Average (MA)
• ARIMA
• Partial Autocorrelation Function (PACF)
Module 10: Text Analysis
• Term
• Corpus
• Text normalization
• Term Frequency – Inverse Document Frequency (TFIDF)
• Topic modelling
• Sentiment Analysis
Module 11: Advanced analytics—technology and tools
• Introduction to advanced analytics—technology and tools
• Hadoop ecosystem
• In-database analytics SQL essentials
o SQL Queries
o Regular expressions
o User-defined functions
o Window functions
• Advanced SQL
• NoSQL
• MADlib
Module 12: Putting it all together
• Preparing to operationalize
• Preparing project presentations
• Data visualization techniques
Schedule
Click on the following link to see the current Course Schedule
Our minimum class-size is 3 for this course.
If there are no scheduled dates for this course, it can be customized to suit the time and skill needs of clients and it can be held online, at a rented location or at your premises.
Click on the following link below to arrange for a custom course: Enquire about a course date
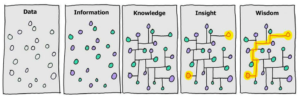
Data is created constantly, and at an ever-increasing rate. Mobile phones, social media, imaging technologies to determine a medical diagnosis-all these and more create new data, and that must be stored somewhere for some purpose. Devices and sensors automatically generate diagnostic information that needs to be stored and processed in real time. Merely keeping up with this huge influx of data is difficult, but substantially more challenging is analyzing vast amounts of it, especially when it does not conform to traditional notions of data structure, to identify meaningful patterns and extract useful information. These challenges of the data deluge present the opportunity to transform business, government, science, and everyday life.
“Big Data” is data whose scale, diversity and complexity require new architecture, techniques, algorithms, and analytics to manage it and extract value and hidden knowledge from.
Although the volume of Big Data tends to attract the most attention, generally the variety and velocity of the data provide a more apt definition of Big Data. (Big Data is sometimes described as having 4 Vs: volume, variety, veracity and velocity.)
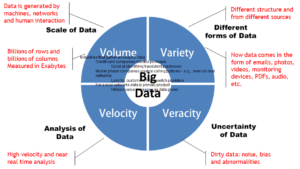
Due to its size or structure, Big Data cannot be efficiently analyzed using only traditional databases or methods. Big Data problems require new tools and technologies to store, manage, and realize business benefits.
The players in this field are data analysts, data engineers and data scientists:
An effective data analyst will take the guesswork out of business decisions and help the entire organization thrive. The data analyst must be an effective bridge between different teams by analyzing new data, combining different reports, and translating the outcomes. In turn, this is what allows the organization to maintain an accurate pulse check on its growth.
The data scientist will uncover hidden insights by leveraging both supervised (e.g. classification, regression) and unsupervised learning (e.g. clustering, neural networks, anomaly detection) methods toward their machine learning models. They are essentially training mathematical models that will allow them to better identify patterns and derive accurate predictions.
Data engineers establish the foundation that the data analysts and scientists build upon. Data engineers are responsible for constructing data pipelines and often have to use complex tools and techniques to handle data at scale. Unlike the previous two career paths, data engineering leans a lot more toward a software development skill set. At larger organizations, data engineers can have different focuses such as leveraging data tools, maintaining databases, and creating and managing data pipelines. Whatever the focus may be, a good data engineer allows a data scientist or analyst to focus on solving analytical problems, rather than having to move data from source to source. The data engineer’s mindset is often more focused on building and optimization


Reviews
There are no reviews yet.